



Crime broadly declined across Idaho over twenty years, but societal and hate crimes rose
Published at | Updated at

POCATELLO – The annual report on Idaho crime statistics has been released, and overall crime appears to be declining in the Gem State – but it’s risen in some key areas.
This is according to data in the “Crime in Idaho 2025” report, which is released annually by the Idaho State Police, Bureau of Criminal Identification Uniform Crime Reporting Program. In the foreword to the 264-page document, the director of the Idaho State Police lays out the human impact of the agency’s work.
“Behind every number is a person, a family, a community, and a story. The information contained in this report helps us better understand where we have made progress, where challenges remain, and where we must continue to focus our efforts,” says Col. Bill Gardiner, director of the ISP.
The Crime in Idaho report provides a statewide view of criminal activity, using data from law enforcement agencies across the state. Using this information, these agencies can determine their “workforce and training needs” and figure out where to focus enforcement efforts.
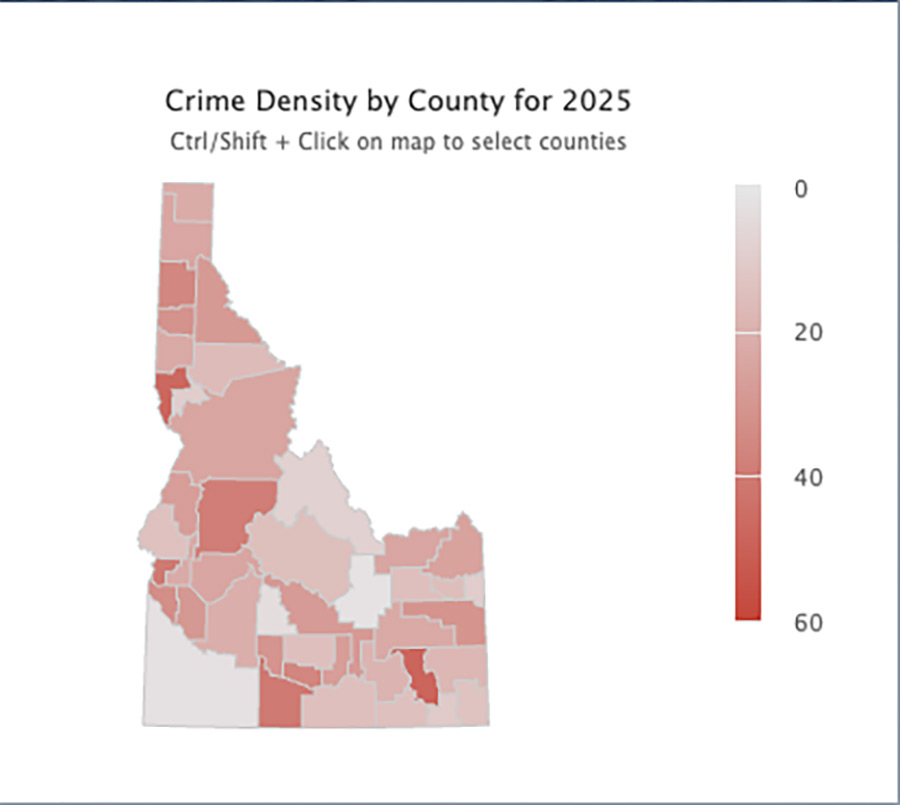
Although not included in the report, the ISP Uniform Crime Reporting System website also provides a map showing county-level crime density for 2025. This map shows that Bannock County, home to the Pocatello Metropolitan Standard area, has the highest crime density in the state.
The report groups crimes committed in Idaho largely into three categories: Crimes Against Persons, Crimes Against Property and Crimes Against Society. Crimes Against Persons refers broadly to crimes like murder, assault and kidnapping; Crimes Against Property encompasses all types of property crime; and Crimes Against Society categorizes primarily drug offenses, as well as other crimes, like illegal gambling or animal cruelty.
Crimes categorized across these three categories are all “Group A” offenses, which are serious offenses that police must report to the FBI’s National Incident-Based Reporting System.
And crime fell across all three categories from 2024 to 2025. Notably, there was a 13% decrease in property crimes, with 23,879 in 2025. Then there were 18,009 recorded crimes against persons, a 3% decrease, and, with 25,001 total society crimes reported, a 3% decrease.
In 2025, a total of 66,889 Group A offenses were reported.
Given these decreases, the number of Group A offenses, which encompasses all three categories, fell overall. In 2025, the number of Group A crimes reported decreased by 12% from 2024.
But how do the numbers from 2025 compare to the reported numbers from 20 years previous? To answer this question, EastIdahoNews.com consulted “Crime in Idaho 2005” to examine how crime rates have changed over time.
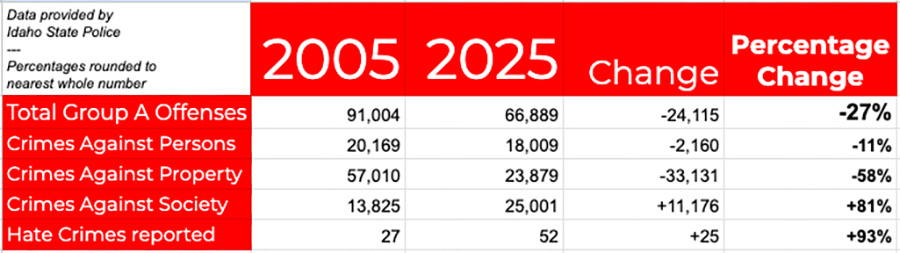
Overall, crime has fallen over the last 20 years, and when looking at each category individually, both person and property crimes have also fallen. However, society and hate crimes have gone up by 81% and 93%, respectively.
While he couldn’t speak to the increase in hate crimes, Sgt. Curt Sproat of the ISP cited a variety of potential reasons for the increase in societal crimes. Some of these reasons were the ISP introducing more focused enforcement methods, as well as the arrival of fentanyl at the beginning of this decade.
Alarm bells really started going off for ISP, “when the amount of people dying from drugs, which is attributed a lot to fentanyl, has doubled the amount of people that are dying in car crashes,” Sproat said.
“We established this full-time drug enforcement patrol team – the Domestic Highway Enforcement Team, which has helped,” Sproat said. “But as I said, it’s an ongoing battle.”
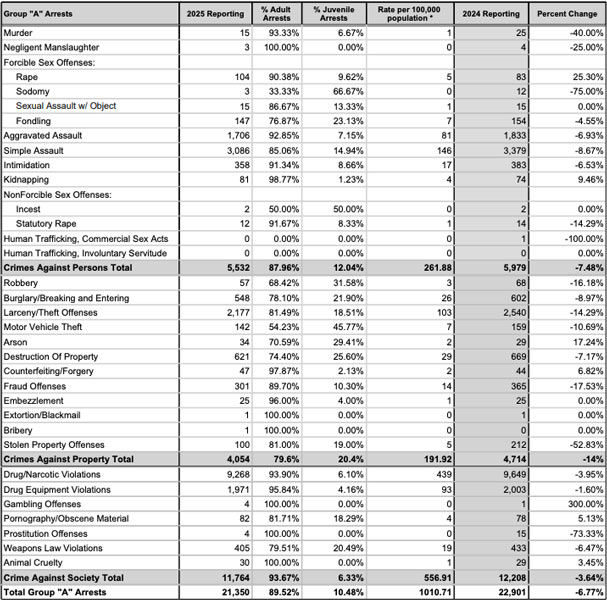
The crimes categorized into persons make up a wide range of crimes, including murder, nonconsensual and consensual sexual offenses, assault, intimidation, kidnapping, and human trafficking. The most commonly reported crime out of these was by far simple assault, with 10,545 reports, with aggravated assault in second with 3,305 reports and intimidation in third with 1,872 reports.
For Property, these crimes include a number of theft offenses, a range of fraud offenses, and arson and destruction of property. The number of offenses reported had a wider range than persons, with the top being larceny/theft offenses at 9,605 reported incidents, 5,049 reported incidents of destruction of property, and 4,941 reported incidents of fraud.
The crimes categorized under society are drug/narcotic violations, drug equipment violations, gambling offenses, pornography/obscene material, prostitution offenses, weapons law violations and animal cruelty. The most commonly reported of these was drug/narcotic violations at 12,540 incidents, and then drug equipment violations with 10,678 incidents. A distant third was weapons law violations, with 1,150 reports.
And how many of these incidents resulted in arrests? According to the report, there were 21,350 arrests in 2025.
This means that 45,539 incidents did not result in an arrest.
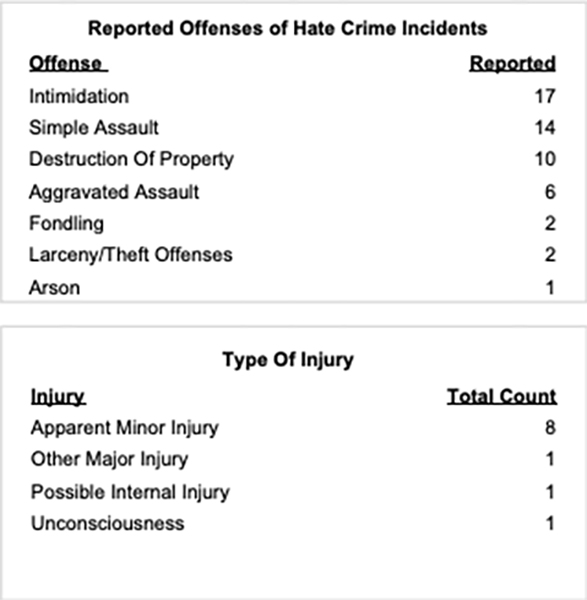
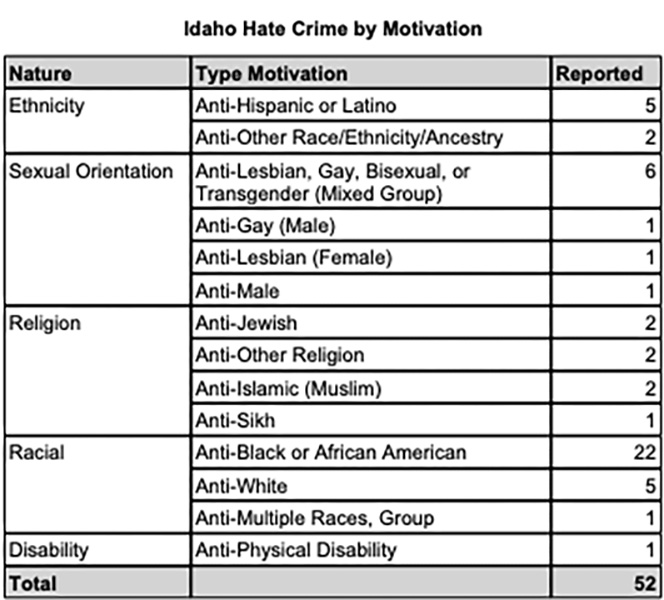
And for hate crimes, the most common offense reported was intimidation, with 17 reported incidents, followed by 14 instances of simple assault and ten of destruction of property. Hate crime offenses also included aggravated assault, fondling, larceny/theft offenses and arson.
The most common motivation out of all the ones recorded in the report was Anti-Black or African American sentiment, with 22 reported incidents.
Of the total reported incidents, 17 were cleared. The report clarifies that:
“Offenses are considered ‘cleared’ when at least one offender is arrested for a crime, or the reporting agency clears the offenses by exceptional means,” the report clarifies. It adds that, “unfounded reports, those deemed to be false, without merit, or in fact did not occur, are not counted.”
Exceptional clearances are made when “at least one offender is positively identified (exact age, sex, and race), sufficient probable cause to support an arrest or charge exists, offender’s location is known so that an arrest could be made, and a physical arrest is not possible due to specific circumstances outside the control of law enforcement,” the document says.
This means that out of the 52 reported incidents of hate crimes, 35 of them went uncleared. And police officers found all of them to be credible, otherwise they wouldn’t have appeared in the report.
But how does the share of Group A incidents resulting in arrests compare to 2005? While an exact ratio can not be made due to the report measuring individuals arrested, and some incidents may have resulted in multiple arrests, the numbers show a clear trend towards more individuals arrested per incident
In 2005, there were 26,670 Group A arrests made in total, which is only 5.320 more arrests than what was made in 2025. In 2005, there were 24,115 more incidents than in 2025.
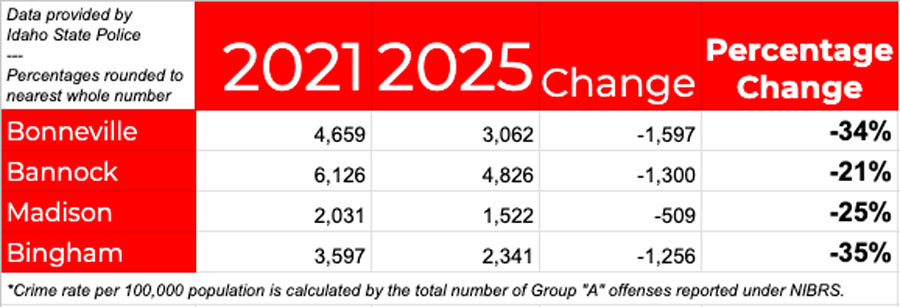
How does eastern Idaho compare to the rest of the state? The 2025 Idaho Crime Report includes tables that show the National Incident-Based Reporting System (NIBRS) crime rate by county, from 2021 to 2025.
When looking at the four most populous counties in the region: Bonneville, Bannock, Madison and Bingham, the data shows that the crime rate has fallen across all four counties.
And while Bannock County has the highest crime rate out of the four counties, it used to be much higher, with a wider gap between the other three. In 2005, Bannock County’s NIBRS crime rate was 10,606, making a difference of 5,780 between that and the 2025 rate.
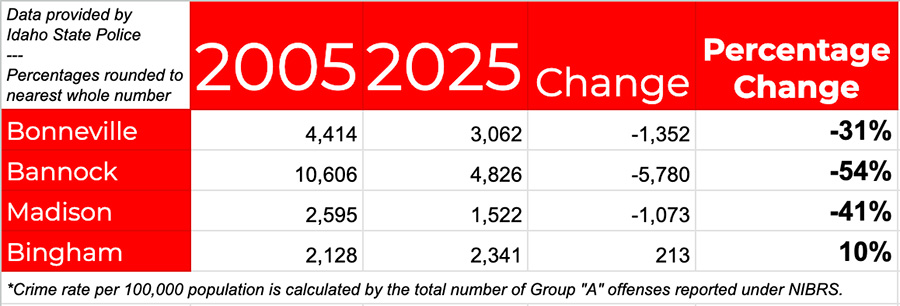
But according to Sproat, the higher crime rate in Bannock County may not necessarily mean it’s less safe to live in Pocatello or Chubbuck. Rather, the higher rate could instead come down to the area’s geography, because of its location at the crossroads of Interstate 15 and 84.
“With the two different major corridors intersecting in Bannock County, there’s a higher frequency of people coming through, so it’s certainly an area we concentrate on,” Sproat said.